Using Taiga Finance
Spending pace
A reference for the Spending pace report, which tracks this month's spending day by day against an earlier month or your recent average.
Spending pace shows whether this month’s spending is ahead of or behind where it usually stands by this day of the month. Open Reports, then Spending pace. The chart draws this month’s spending as it accumulates, against your average month or one earlier month. Below it, each category group shows how far it has moved from the same comparison.
What is spending pace?
Section titled “What is spending pace?”On the 18th, a month-to-date total is hard to set against last month’s full total. Rent and insurance land early and groceries arrive all month, so spending doesn’t build evenly. Spending pace compares spending through today with what the comparison had reached by the same day.
How do I read the chart?
Section titled “How do I read the chart?”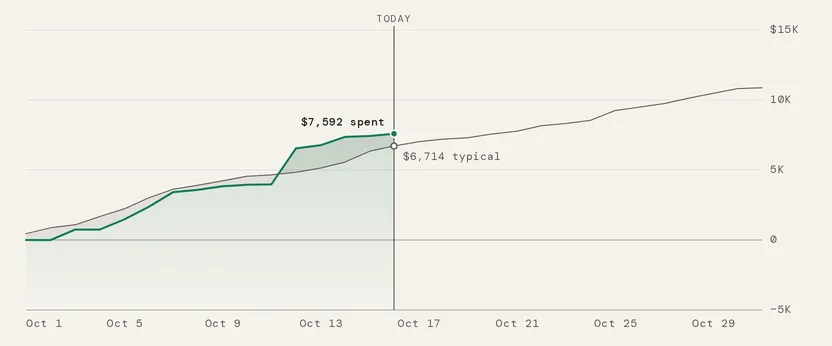
The line that stops at today is this month’s spending, added up day by day. A refund pulls it down. The line that runs the whole month is the comparison. The shaded band between them, up to today, is the difference. A vertical line marks today, with both amounts labelled where the lines cross it.
The report always covers the month, or year, that contains today. A finished month appears only as the comparison.
What do the four figures mean?
Section titled “What do the four figures mean?”
| Figure | What it is |
|---|---|
| Spent so far | Settled spending this month, with refunds subtracted. |
| The comparison by day N | What the comparison had reached by the same day of its month. |
| Difference | The first figure minus the second. Positive means more spent than the comparison by this point. It carries no color. |
| Projected month end | Spent so far, plus what the comparison adds over the rest of its month. |
Hover a figure to see how it was calculated.
What can I compare against?
Section titled “What can I compare against?”
| Control | Options | What it does |
|---|---|---|
| Filters | Category group, Subcategory, Account, Merchant, and Person in a household of two | Limits both lines, the figures, and the group list to matching transactions. |
| Period | Month, Year | Year tracks the year so far against last year. |
| Comparison | Month, Avg | Month compares against one earlier month. Avg compares against the average of your last completed months. |
| Comparison month | vs a month, with ‹ and › | Under Month, steps the comparison back through earlier months. |
| Average window | 3M, 6M, 12M | Under Avg, sets how many completed months go into the average. It opens at 6M. |
| Add projection | On, off | Extends this month’s line to month end along the comparison’s path. |
The average is built day by day. Taiga Finance adds up each completed month’s spending through every day, then averages those running totals. The month in progress never goes into its own average. A month that ends on the 28th or 30th holds its final total through the 31st.
Which groups are running ahead or behind?
Section titled “Which groups are running ahead or behind?”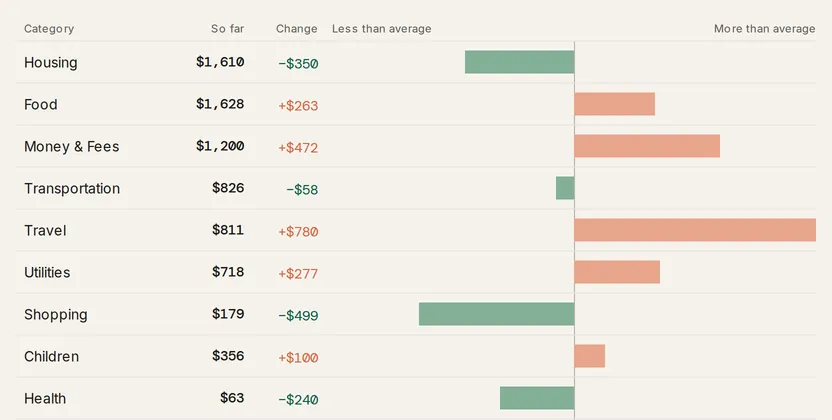
By category group lists up to sixteen groups with So far and Change, the gap between this month and the comparison through today. A bar reaching right, in coral, means more than the comparison. A bar reaching left, in teal, means less. The longest bar is the largest change, and the others scale to it. No change marks a gap under a dollar.
Click a group to filter the whole report to it. The chart, the figures, and the list redraw for that group alone, and the group appears as a chip on the control row. Clicking another group replaces the first. Click the active group again to clear it.
What else is on the page?
Section titled “What else is on the page?”Still to come lists what the comparison adds between today and month end, by group. Month ends charts the final totals of your last six months beside this month’s figure. Largest this month lists the ten largest transactions, and View all N in ledger → opens Transactions with the same month and filters. On a narrower window, these three sections sit behind the Summary button beside the title.
Troubleshooting
Section titled “Troubleshooting”Three of the four figures show a dash.
Section titled “Three of the four figures show a dash.”Those three figures show a dash under a NO PRIOR DATA label. No completed month is available to compare against, so only Spent so far has a value. The comparison appears once a full month of transactions exists. Importing older transactions fills it in sooner.
A figure says “Avg of 4/6 months.”
Section titled “A figure says “Avg of 4/6 months.””Your history covers four of the six months requested. The average uses those four. Switch to 3M for a window your history fills.
Avg is greyed out.
Section titled “Avg is greyed out.”Avg is available under Month only. Under Year, the comparison is always last year, and clicking Avg says so. Switch Period to Month to use it.
The line is nearly flat early in the month.
Section titled “The line is nearly flat early in the month.”Little has settled yet. Pending transactions don’t count until they post, so the first days of a month run low.
A note under the chart reads “rows are hidden from you — these totals understate.”
Section titled “A note under the chart reads “rows are hidden from you — these totals understate.””Transactions your partner keeps private are left out of your totals, in this month and in the comparison alike. See Couples & household visibility.
Can I look at last month’s pace?
Section titled “Can I look at last month’s pace?”No, only as the comparison. The report always covers the month, or year, that contains today. Set Comparison to Month to draw last month as the line this month runs against.
What counts as spending here?
Section titled “What counts as spending here?”Settled spending, net of refunds. Income, transfers between your accounts, pending transactions, and transactions hidden from budgets are left out. This is the same rule as the Expenses figure on Cash flow.
Is the projection a forecast?
Section titled “Is the projection a forecast?”No. It adds spent so far to what the comparison spent over its remaining days. Upcoming bills aren’t part of it.
Is this the same as the “Spending” tile on the Today page?
Section titled “Is this the same as the “Spending” tile on the Today page?”Yes. The Spending tile on Today is a small version of this report and links here. Show on Today in the ⋯ menu beside the title adds or removes it.
Can I get back to the same comparison later?
Section titled “Can I get back to the same comparison later?”Yes. The period, comparison, window, projection, and filters are kept in the page address, so a bookmark reopens the same view.