Using Taiga Finance
Cash Flow Sankey
How the Cash Flow Sankey draws one month, quarter, or year as a flow from income to spending groups and savings, and what clicking a part of it shows.
The Cash Flow Sankey draws a single period as a flow. Income enters on the left. Each ribbon on the right is as thick as the money that went to that spending group. Whatever was left over is shown as Net saved. Open Reports, then Cash Flow Sankey. It opens on your latest complete month. Click any part of the diagram to see the transactions behind it.
What is a Sankey diagram?
Section titled “What is a Sankey diagram?”A Sankey diagram is a flow chart in which each ribbon’s width is an amount of money. A month with one paycheck and nine places it went is hard to take in as a table of ten numbers. Drawn as ribbons, the widest is the biggest share. The ribbon for savings sits beside the spending ribbons at the same scale. To compare periods, use Cash flow.
How do I read the diagram?
Section titled “How do I read the diagram?”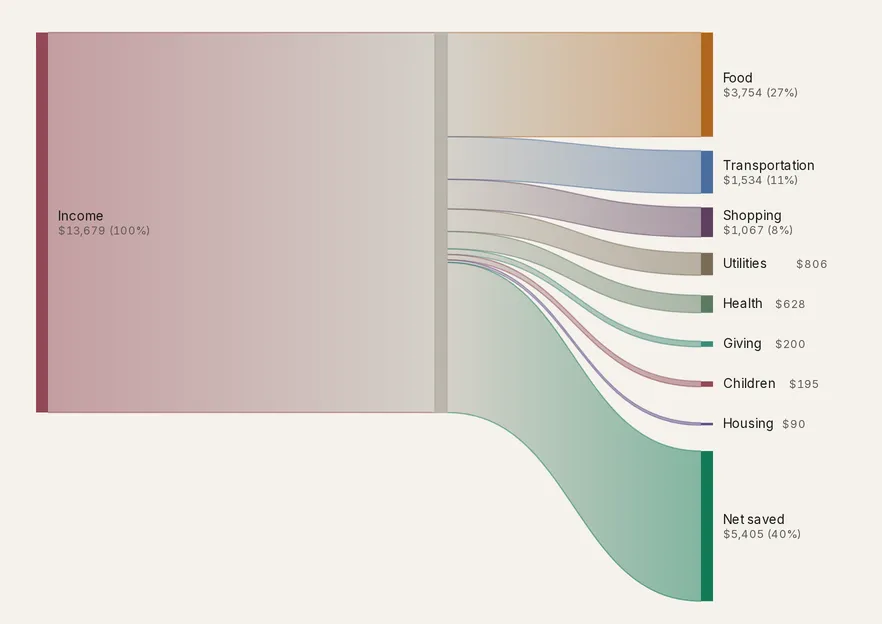
- Left side. One block per income category.
- Trunk. The neutral bar in the middle is the period’s total flow. Hover it for the amount.
- Right side. One block per spending group, labelled with its amount and its share of the total. Groups are the top level of your categories.
- Net saved. When income exceeds spending, the difference gets its own block on the right. When spending exceeds income, a faint Savings drawdown block appears on the left instead, covering the gap.
With more than eight spending groups, the seven largest keep their own block and the rest fold into a hatched Everything else block. Hover it to see its members. A group with refunds is drawn at its spending before refunds, and its hover readout lists the refunds and the net.
What do the controls change?
Section titled “What do the controls change?”
| Control | Options | What it does |
|---|---|---|
| Filters | Account, Category, Merchant | Limits the flow to the transactions that match. With a filter on, the savings block reads Net and the drawdown block reads Funding. |
| Data mode | Actual, Plan | Actual draws what happened. Plan draws the current month of your plan the same way. The filters, the depth, and the time window are hidden in this mode, and the stepper is disabled. |
| Depth | Groups, Detail | Detail adds a column that fans each group out into its categories. |
| Period stepper | ‹ and › | Moves one period earlier or later. The current, unfinished period is tagged TO DATE. |
| Time window | Month, Quarter, Year | Sets what one period covers. |
What happens when I click a block?
Section titled “What happens when I click a block?”Clicking a block, its label, or the ribbon into it selects that block. The ribbons that don’t touch it dim, and the band under the diagram switches to it.
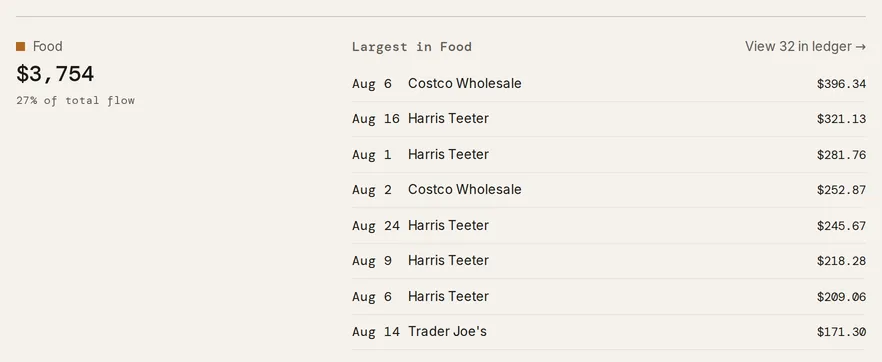
The band names the block, its amount, and its share of total flow. Largest in lists that block’s eight largest transactions for the period. Click a transaction to open it in place. View N in ledger → opens Transactions filtered to the same period, block, and filters. Click the selected block again to clear it, and the band returns to the whole period under Largest transactions.
What does the “Spending mix” chart show?
Section titled “What does the “Spending mix” chart show?”Spending mix, above the band, stacks spending by group for the trailing twelve periods, in the same colors as the diagram. Dollars and Share switch between amounts and percentages. Clicking a column moves the diagram to that period.
Troubleshooting
Section titled “Troubleshooting”The page reads “No cash flow yet.”
Section titled “The page reads “No cash flow yet.””Taiga Finance has no settled transactions. Use Import transactions or Connect an account on the page. The diagram fills in once transactions arrive.
The page reads “No activity in” followed by the period.
Section titled “The page reads “No activity in” followed by the period.”The period you stepped to has no income or spending. Step to another period.
Plan mode reads “No plan yet.”
Section titled “Plan mode reads “No plan yet.””Plan draws your plan, and none is set up. Set up your plan opens Plan.
The depth toggle is missing.
Section titled “The depth toggle is missing.”The Groups and Detail toggle needs a wide window. On a narrow one the diagram stays at Groups and the toggle is hidden.
A group I spent in has no block.
Section titled “A group I spent in has no block.”With more than eight spending groups, a small group is inside Everything else. Hover that block to see its members. Otherwise the group’s refunds for the period matched or exceeded its spending, so nothing is left to draw.
Why is there only one income block?
Section titled “Why is there only one income block?”Each income block is one income category. Paychecks from two jobs share one category, so they draw as one block. Give them separate income categories to see them apart.
Do transfers and credit card payments appear?
Section titled “Do transfers and credit card payments appear?”No. Anything under Transfers is left out, along with pending transactions and transactions hidden from budgets. These are the same rules Cash flow uses, so the two reports agree for the same period.
Can I see merchants in the diagram?
Section titled “Can I see merchants in the diagram?”No. The diagram stops at categories. Filter by Merchant to draw one merchant’s flow, or select a block to list its largest transactions.
Can I put this on Today?
Section titled “Can I put this on Today?”Yes. Open the ⋯ menu beside the title and choose Show on Today. See Reports.