Using Taiga Finance
Cash flow report
How the Cash flow report draws income, spending, and net by period, and how to break one period down by category, group, or merchant.
Cash flow shows what came in, what went out, and the difference, for every month, quarter, or year of your history. Open Reports, then Cash flow. The chart covers the range you choose, up to your whole history. Click any column and the figures and the breakdown under the chart switch to that one period.
What is the Cash flow report?
Section titled “What is the Cash flow report?”The Cash flow report is one chart of income against spending over time, with one period broken down beneath it. A month with a bonus has a tall income column. A month with a tuition payment has a deep spending column. The net line shows which months took in more than they spent.
How do I read the chart?
Section titled “How do I read the chart?”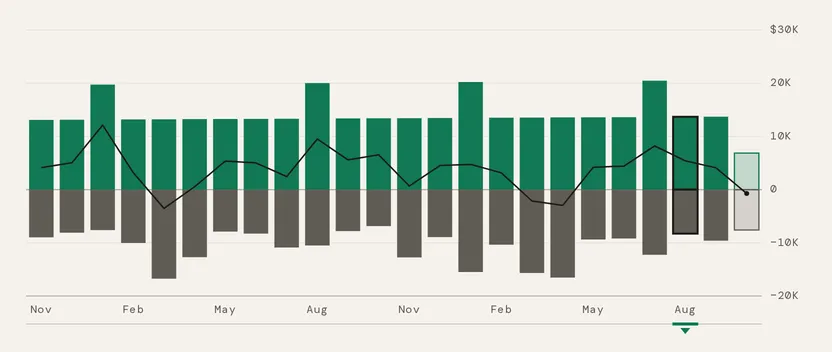
Each period gets a column. Income rises above zero and Spending hangs below it. The line is Net, income minus spending, with a dot on its last point. The period in progress is drawn faded, because its totals are incomplete. The Spending columns are the same total as the Expenses figure. Hover a column for its three figures.
The selected period has an outline and a marker under the axis. With nothing chosen, Taiga Finance selects the latest period that has activity.
What do the four figures mean?
Section titled “What do the four figures mean?”
| Figure | What it is |
|---|---|
| Income | Everything in the Income category for the period. A reversed paycheck subtracts. |
| Expenses | Every other settled transaction outside Transfers, with refunds subtracted. Transactions hidden from budgets are left out. |
| Net cash flow | Income minus expenses. |
| Savings rate | Net cash flow as a share of income. It reads — in a period with no income. |
Hover a figure to compare it with the Previous period and with Typical, the average of the completed periods in the range.
Where did one period’s money go?
Section titled “Where did one period’s money go?”Under the chart, the selected period’s name heads two bands, Income and Expenses. Each row shows a label, its share of the band, and the amount, largest first.
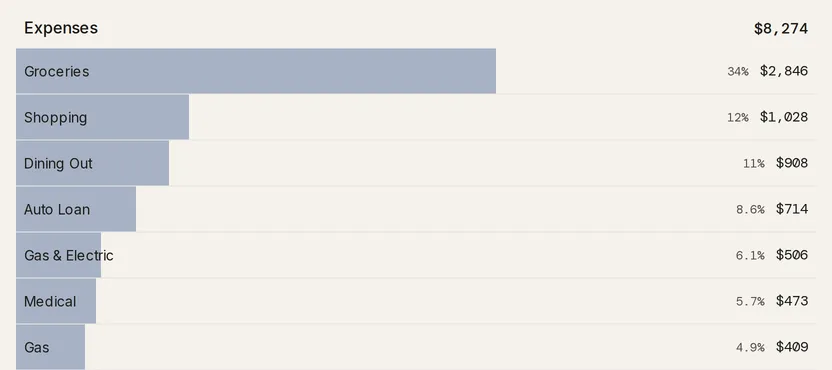
The toggle beside the period’s name regroups both bands by Category, Group, or Merchant. Hover a row for its total, its transaction count, and its five most recent transactions.
Clicking a row filters the whole page to it. The chart, the four figures, and both bands redraw for that category, group, or merchant alone, and the row appears as a chip on the control row. Click the row again, or the chip’s ×, to remove it.
What do the controls change?
Section titled “What do the controls change?”
| Control | Options | What it does |
|---|---|---|
| Filters | Category groups and subcategories, Account, Merchant | Limits every number on the page to the transactions that match. |
| Chart mode | Full, Net | Full draws income and spending with the net line. Net draws one bar per period, above or below zero. |
| Granularity | Monthly, Quarterly, Yearly | Sets what one column covers. |
| Range | 1Y to 10Y, and All | Sets how far back the chart reaches. The options depend on the granularity, and a range as long as your history, or longer, is left out. |
When the filters leave only spending, or only income, the chart switches to plain upward bars for that side.
What else is on the page?
Section titled “What else is on the page?”In this window names the Highest and Lowest net periods in the range. Clicking either selects it on the chart. Recent transactions lists up to ten transactions from the selected period, and View all N in ledger → opens Transactions filtered to the same period and filters. On a narrower window, both sit behind the Summary button beside the title.
Troubleshooting
Section titled “Troubleshooting”The page reads “No cash flow yet.”
Section titled “The page reads “No cash flow yet.””Taiga Finance has no settled transactions. Use Import transactions or Connect an account on the page. The chart fills in once transactions arrive.
The page reads “Nothing matches these filters.”
Section titled “The page reads “Nothing matches these filters.””The filter chips on the control row leave no transactions in the range. Remove a chip, or click Clear all.
A band reads “No income this period” or “No expenses this period.”
Section titled “A band reads “No income this period” or “No expenses this period.””The selected period has nothing on that side, often because of a filter. Select another column, or remove the filter.
A range option I expect is missing.
Section titled “A range option I expect is missing.”Range options as long as your history, or longer, are hidden. All is always offered and reaches your first transaction.
Savings rate reads “—”.
Section titled “Savings rate reads “—”.”The period has no income, so the rate can’t be calculated. Taiga Finance shows a dash there, not 0%.
Do transfers and credit card payments count?
Section titled “Do transfers and credit card payments count?”No. Anything under Transfers is neither income nor spending, and a card payment is a transfer. The purchases on the card already count as spending.
Do pending or hidden transactions count?
Section titled “Do pending or hidden transactions count?”No. Only settled transactions count, and a transaction hidden from budgets is left out. A pending charge joins its period once it posts. Every report follows the same rules. See Reports.
Why is a refund not income?
Section titled “Why is a refund not income?”A refund lowers spending. A positive amount in a spending category subtracts from that category’s expenses. Only transactions in the Income category count as income.
Can I see cash flow for one account?
Section titled “Can I see cash flow for one account?”Yes. Open Filters and pick the account. Every figure, the chart, and both bands then cover that account alone.
Can I put this on Today?
Section titled “Can I put this on Today?”Yes. Open the ⋯ menu beside the title and choose Show on Today. See Reports.
How is this different from the Sankey report?
Section titled “How is this different from the Sankey report?”Cash flow compares periods. The Sankey draws one period in detail. Both use the same transactions and the same rules. See Cash Flow Sankey.