Using Taiga Finance
Net worth by class
What the Net worth by class report draws, how an account lands in a band, and which balance reading each month uses.
Net worth by class shows what your net worth is made of, and how that mix has moved. Open Reports, then Net worth by class. The page itself is titled Net worth composition. Each month stacks your assets above zero and your debts below it, one band per class of account, with your net worth drawn as a line through them.
What is net worth composition?
Section titled “What is net worth composition?”A household’s net worth can rise because a mortgage was paid down, the market rose, or cash was saved. The total looks the same in all three cases. This report splits the total into bands such as Retirement, Real Estate, and Mortgage. You can see which band grew, which shrank, and how much of what you own is matched by what you owe.
How do I read the chart?
Section titled “How do I read the chart?”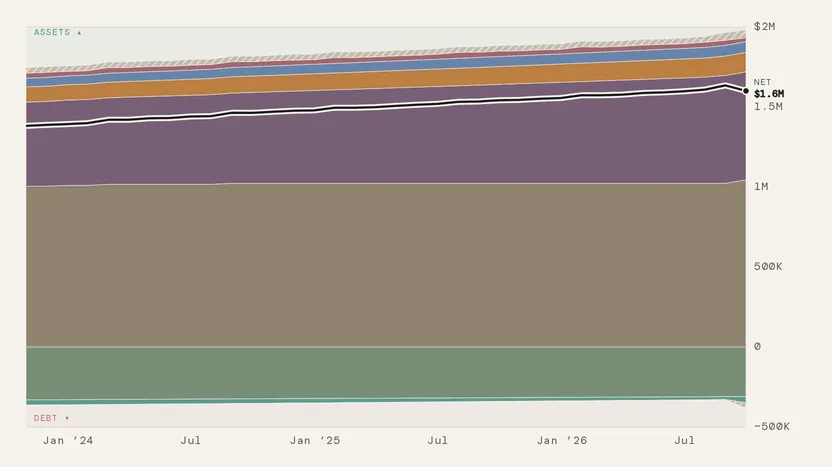
Everything above the zero line is something you own, tagged ASSETS. Everything below it is something you owe, tagged DEBT. The dark line is NET, assets minus debt, with the latest figure at its right edge. Hover any month to list every band’s amount for that month, with Assets and Liabilities subtotals.
With more than eight bands, the smallest on each side fold into a hatched Rest band. Hovering lists what is inside it.
Which bands are there?
Section titled “Which bands are there?”| Side | Bands |
|---|---|
| Assets | Cash & Checking, Savings, Taxable Investments, Crypto, Retirement, 529 Education, HSA, Real Estate, Other Assets |
| Debt | Mortgage, Home Equity, Credit Cards, Loans, Other Debts |
A band appears only when it has held a balance at some point in your history. An account’s band follows its type. A checking account lands in Cash & Checking, an IRA or a 401(k) in Retirement, a property in Real Estate, a HELOC in Home Equity. To move an account to another band, change its type. See Managing accounts.
What do the three figures mean?
Section titled “What do the three figures mean?”
Liabilities is shown as a negative amount, so Net worth is Assets plus Liabilities. The figures cover the bands currently drawn, so filtering out a class changes all three.
The figures follow your pointer. Hover a month and they show that month. Click a month to hold them there after the pointer leaves. Click the same month again to return to the latest.
What do the controls change?
Section titled “What do the controls change?”
| Control | Options | What it does |
|---|---|---|
| Filters | Classes, grouped under Cash, Investments, Real Estate, Credit, Loans, and Other | Picks which bands are drawn. The first click on a class shows that class alone, and further clicks add classes back. A group’s name toggles the whole group. |
| Composition mode | By type, Totals | Totals collapses the chart to two bands, Assets and Liabilities. |
| Chart form | Area, Bars | Draws the months as continuous bands or as one bar each. |
| Window | 6M, 1Y, 3Y, All | Sets how many months are drawn. |
When some classes are filtered out, a note on the chart counts them, as in 8 of 10 classes.
What else is on the page?
Section titled “What else is on the page?”Monthly change charts how much your net worth rose or fell each month, split by the class that moved it. It appears once you have two months of history. By class is a grid with one cell per band, each holding the band’s name, a small trend line, and its latest value.
Where do the monthly values come from?
Section titled “Where do the monthly values come from?”Each month on the chart uses the last reading on or before that month’s end, and the current month uses today’s. A month with no reading of its own carries the previous one forward. The net line is dashed across that month, and hovering it shows Last read with the date.
Troubleshooting
Section titled “Troubleshooting”The page reads “No net worth history yet.”
Section titled “The page reads “No net worth history yet.””No balance has been recorded. Connect an account links a bank, and Import balances loads a balance history file. See CSV & PDF importers.
A row under the chart reads “Building history.”
Section titled “A row under the chart reads “Building history.””Fewer than twelve months of readings exist. The row counts them, as in Building history · 5 of 12 mo, and clears at twelve. Importing a balance history fills in earlier months.
An account is in the wrong band.
Section titled “An account is in the wrong band.”The band follows the account’s type. An account whose type Taiga Finance couldn’t identify is placed by its name, and the name can point to the wrong band. Set the Type row on the account. See Managing accounts.
A band I expect is missing.
Section titled “A band I expect is missing.”With more than eight bands, the smallest on each side are inside Rest. Hover it to see them. Otherwise, a class that has never held a balance gets no band and no filter option. Check that the account is connected, or added as a manual account, and has a balance.
The net line is dashed for a stretch.
Section titled “The net line is dashed for a stretch.”Those months had no reading, so the last known values were carried forward. See Troubleshooting sync.
Can I see the accounts inside a band?
Section titled “Can I see the accounts inside a band?”No. Class is the finest level this report draws. Accounts lists every account with its balance.
Does my partner see the same chart?
Section titled “Does my partner see the same chart?”Yes. This report draws one household total, the same for both of you. It includes accounts either of you keeps Separate, and it never itemizes them. See Couples & household visibility.
How does my home show up?
Section titled “How does my home show up?”As two bands, or three with a HELOC. The property’s value is in Real Estate above the line, and the loan against it is in Mortgage below it. A HELOC is in Home Equity, also below the line. See Real estate.
Can I bookmark this view?
Section titled “Can I bookmark this view?”Yes. The window, the mode, the chart form, and the class filters are kept in the page address. The month you clicked is not.
Can I put this on Today?
Section titled “Can I put this on Today?”Yes. Open the ⋯ menu beside the title and choose Show on Today. See Reports.